The Content suggestion system and its statistics

Cumulative statistics of all suggest boxes and suggestable contents. Daily graphs and cumulative statistics in tables.
To display content suggestions and its statistics click on “Content Suggestion!”

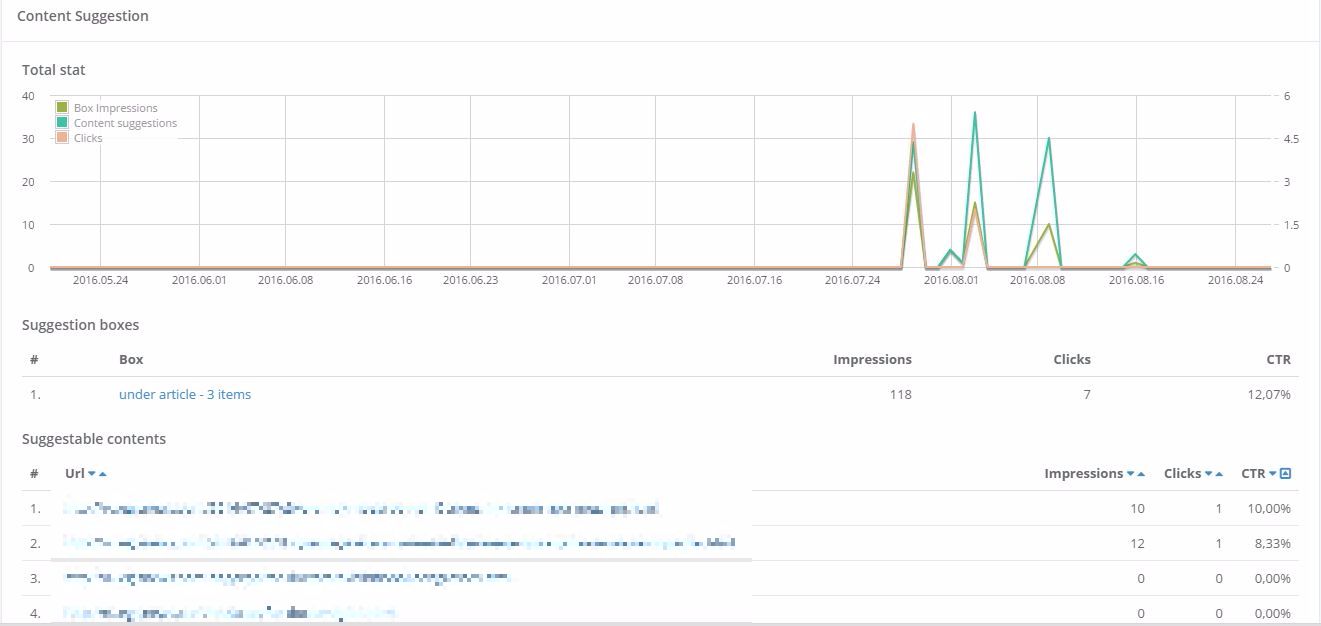
On the next page the basic statistics are displayed. Using the following dictionary it is easy to understand the graphs and numbers:
- Impressions: count of displays (in the box table box, in the content table content displays)
- Content suggestions: count of all displayed content (only for boxes)
- Clicks: clicks on the item
- CTR: click-through rate (clicks/total viewers of the page)